The Moment of Clarity

Another in the series of posts on analysis of data and finding clarity
I’d covered my floor with printout tables from a variety of papers to help conceptualise how I would achieve what I was supposed to achieve. I didn’t know what I was really supposed to achieve beyond what it should look like. That was the key. I knew it, but also knew it would be regarded by others as stupid if I said that to them. My own view was that I knew enough about how to invent things and would know it when I saw it. So, I stayed silent. I tip-toed around the concepts with one other who knew a lot and had already been down this path, methodologically, yet I also knew it would be impossible to explain this aim until I had achieved it.
Much earlier, my sup. had asked me: “How will you do it? Measure learning effectiveness out of people’s experiences?” or words to that effect. I had said then “I don’t know, I haven’t yet seen the data”. It is always about the data. The data itself will tell you what you are trying to find out, it will even tell you what your aim really is. I’ve done enough research, evaluations and user experience projects to know this. The truth is in the data, and to try to predict it is sheer foolishness. Phenomenography is good at warning people about not trying to fit the data to predetermined categories, and that’s right. But even after you might have kind of devised your categories of experience variation, what then? What are the categories saying? Of course it must be said that phenomenography does not seek to find an essence of a thing, only how people experience it, and the variation of that. But in that variation, if the right questions have been asked, understanding will appear.
So as the variation groupings appeared, I tried to scope out the table. But I could not. I tried to see the relational inclusivity but I could not. I tried to find hierarchy but I could not. Blank. So I spread out all the tables I’d printed out over past months onto the floor, so I could glance at them. So they would be there. I added to them with one or two others, newer discoveries. I puzzled over them… still nothing. I waited. They lay there for days.
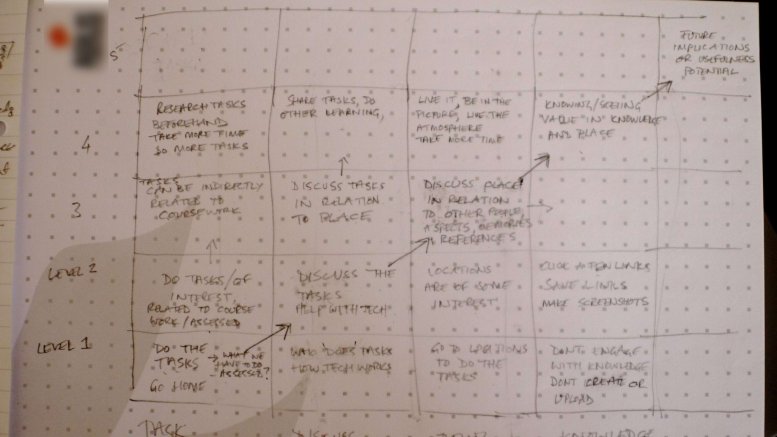
Then, a few days ago and after several more days had passed, I went to sit in the sun for a break in-between the mind numbing task of transcribing. I took a notepad and thought, I’ll just jot down some more ideas… and I just wrote down the relational inclusivity. Like it was nothing. Like I had always known it. Like it was easy. It was a major breakthrough. This was brought out by thinking about the ‘interpretive awareness’ (Sandberg, 1997, p. 209) that must be demonstrated, why you take the decisions you take, how you select one utterance over another to indicate category and dimension of variation.
 The partial relational inclusivity, as I first saw it. To be truthful this clarity had partially emerged as a result of actually writing a paper to report on partial results. Again I had not known how I would write the paper so I let it write itself. It did, fairly successfully. It’s not brilliant, no, but it is a good step.
Then, as I knew I needed the table, I puzzled over it more and still the fuller whole would not come. It was on the tip of my mind, so I waited. And then it did. Just as easily, I drew the table and made the mental connection that it was diagonally hierarchical, in a table of complexity and understanding. Because this table worked horizontally, vertically and diagonally, it suddenly made sense, in all directions, logically. I could also bring the idea of pedagogical structure of relevance, that is, adapt Marton & Booth’s relevance structure (1997, ch. 7) to a pedagogical approach for such flexible kinds of learning. I could literally now attach the relevance structure to the table (given a bit more work).
That’s as far as I’ve got. Still messy, and needs more confirmation from the rest of the data,plus other things…. but it’s there. I can see it.
References
- Marton, F., & Booth, S. (1997). Learning and Awareness. Mahwah, NJ: Lawrence Erlbaum Associates
- Sandbergh, J. (1997). Are Phenomenographic Results Reliable? Higher Education Research & Development. 16:2, 203-212, DOI: 10.1080/0729436970160207. Available at: http://dx.doi.org/10.1080/0729436970160207